Washington, DC Housing Market Update: August 2026
Closed sales in DC were down more than 20% this August compared to last year. If you stopped reading right there, you'd think the market had fallen off a cliff. It hasn't — and the fuller picture is actually a lot more interesting than that headline number suggests.
Here's the full August 2026 breakdown for Washington, DC.
New Listings: Essentially Flat Year Over Year
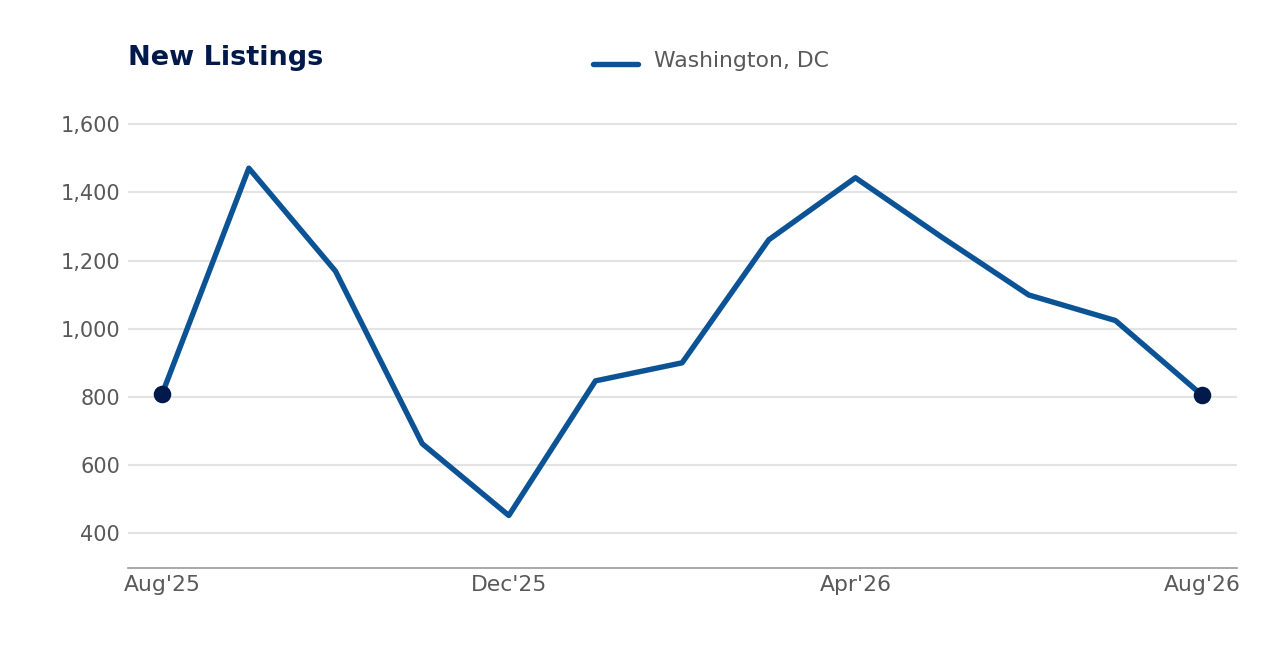
805 new listings hit the DC market in August, down just 0.5% from the 809 we saw in August 2025 — a rounding error, not a trend. For all the noise about the market shifting, sellers aren't behaving any differently than they were a year ago — they're listing at close to the same pace.
Worth addressing directly, since the chart above makes it look dramatic: new listings dropped from nearly 1,500 in September down to 805 by August. That's not a market in decline — it's the same seasonal cycle DC sees every single year. September is reliably the highest new-listing month (a post-Labor Day surge), and August is reliably one of the lowest. That's been true in every year of MLS data going back through 2021, regardless of market conditions. The number that actually tells you something is the year-over-year comparison at the same point in that cycle — and on that measure, this August looks just like last August.
That steadiness matters. It means whatever is happening on the demand side this month isn't being driven by a flood or a drought of new inventory. The story is somewhere else.
Active Listings: Holding Right at Last Year's Level
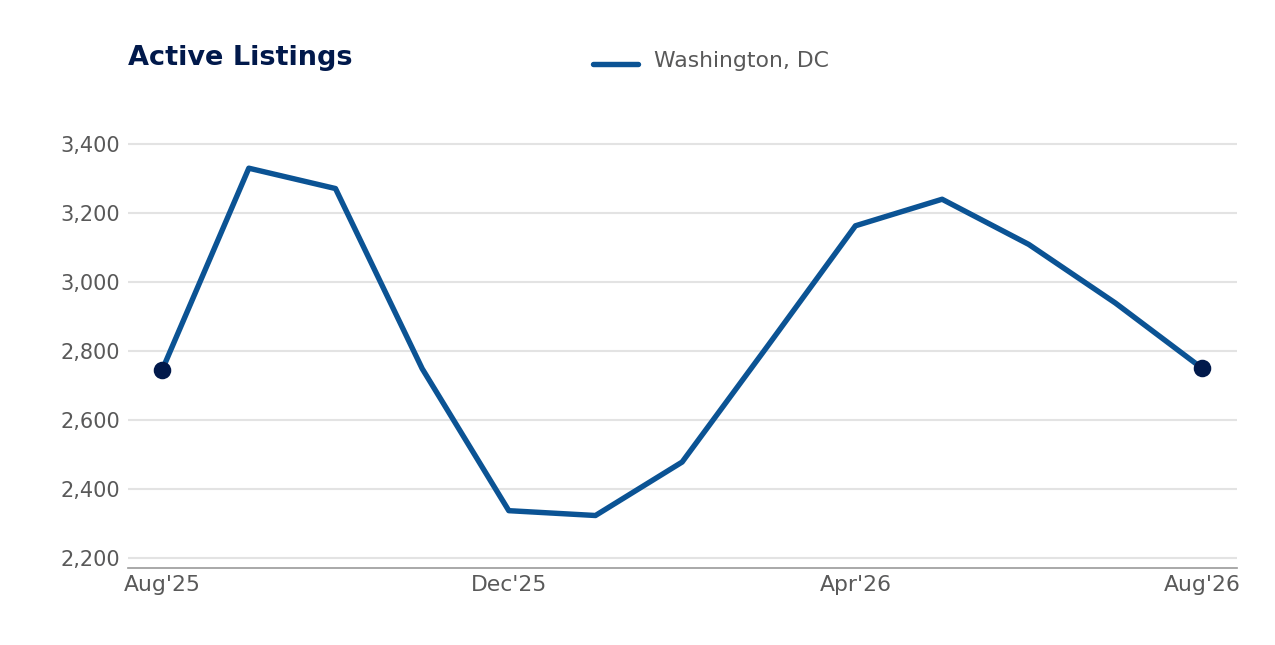
We ended August with 2,749 active listings, just 0.2% above the 2,744 we had at this point last year — essentially unchanged. Months of supply sits at 4.4, barely different from 4.3 a year ago.
Bottom line: inventory isn't the variable moving this market right now. A 4-to-4.5-month supply is a reasonably balanced number — not a buyer's flood, not a seller's drought. Whatever shifted this August, it wasn't the shelf space.
Closed Sales: Down 22% Year Over Year
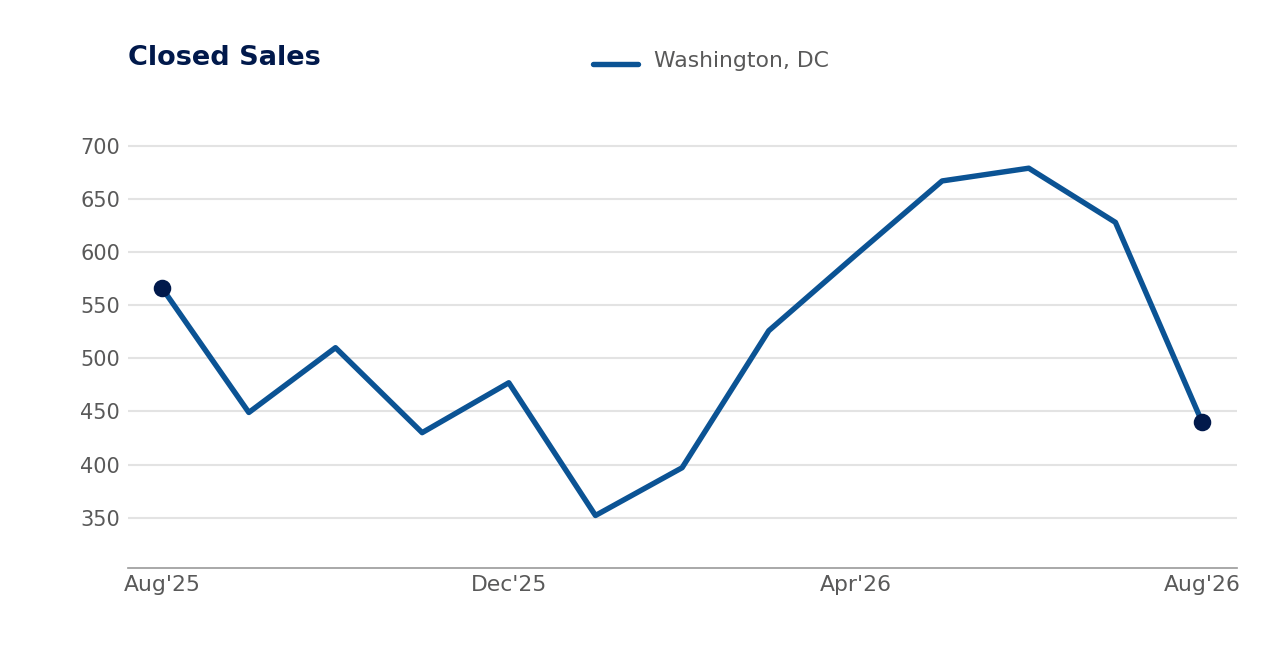
440 homes closed in DC this August, down from 566 last August — a 22.3% drop. That's the number that jumps out, and it's a real one, not a rounding error.
Worth watching alongside it: only 218 homes are currently pended (under contract), down about 19% from 269 a year ago. That's a leading indicator, and it's pointing the same direction as closed sales — fewer deals are in the pipeline behind this month's numbers too, not just fewer deals that already closed.
Don't read this as "nobody is buying." Four hundred and forty closed transactions is still a lot of people moving. But with new listings and active inventory both flat, the drop in closings tells you demand cooled more than supply did this year — not the other way around.
Days on Market: Up 13% Year Over Year
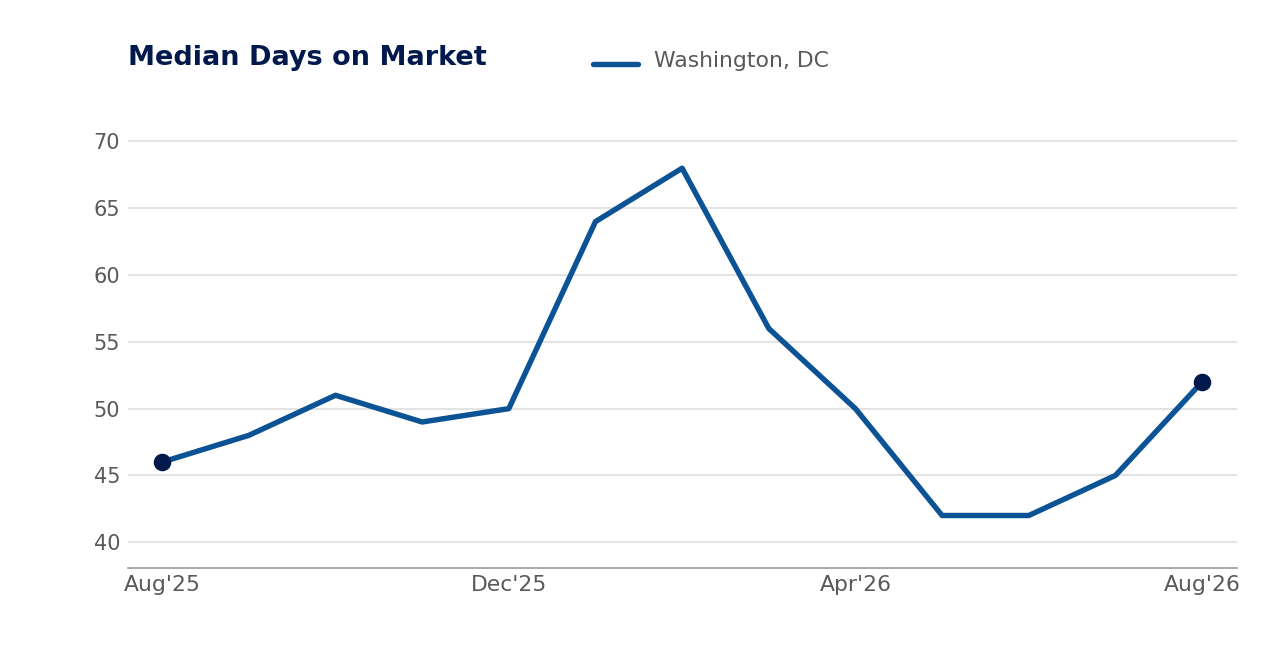
The median days on market climbed to 52 days, up from 46 last August — a 13% increase. Cumulative days on market (which counts relisted properties too) rose even more, from 59 to 71 days, up over 20%.
If new listings and active inventory are flat but homes are taking longer to sell, that's the clearest sign in this whole report that buyer urgency has eased. The homes that are priced right, shown well, and marketed properly are still moving. Everything else is sitting longer than it would have a year ago. The three-part test hasn't changed:
- Priced right relative to current comps, not last year's comps.
- Shows well — move-in ready and staged, not "as-is and hoping."
- Marketed beyond the MLS — professional photos, real promotion, not a sign in the yard.
Miss any one of those right now and the extra week or two on market is the cost.
Median Sale Price: $678,000, Up 4.2% Year Over Year
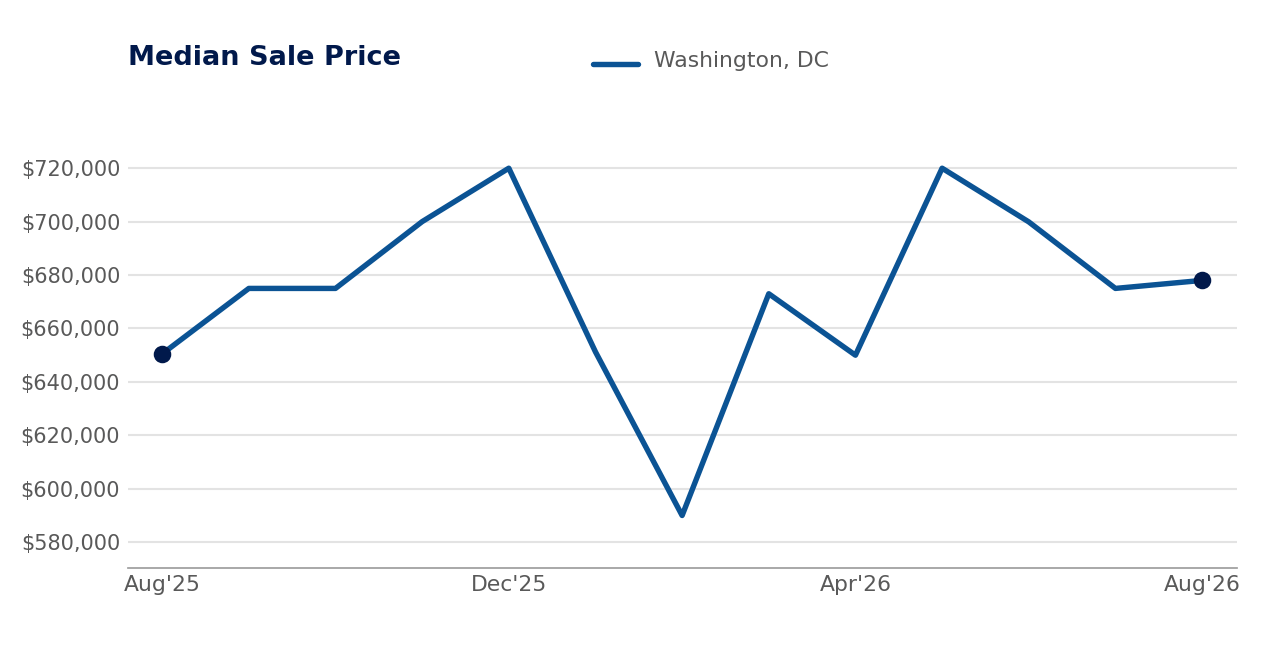
The median sale price came in at $678,000, up 4.2% from $650,500 last August. Given that closed sales dropped 22% and days on market rose, you might expect price to have softened too. It didn't — prices held.
Here's the part worth actually digging into: the average sale price was $1,042,899, up 23.7% year over year — a much bigger jump than the median's 4.2%. When the average moves that much further than the median, it's almost never a sign that "the whole market" got that much more expensive. It's a sign that a disproportionate number of higher-end sales closed this particular month, pulling the average up without moving the typical transaction nearly as much.
That's the same pattern worth remembering any time you see a single headline stat about DC pricing: the average and the median can tell two different stories about the same month, and the median is almost always the more honest read on what a typical buyer is actually paying.
Jimmy Mackin is correct when he says the market is soft enough to negotiate, but fast enough to punish slow decisions. If you are asking yourself when is a good time to buy or sell the answer is now if that is what fits into your life plan.
Interest Rates: 6.71%, Up Slightly Year Over Year
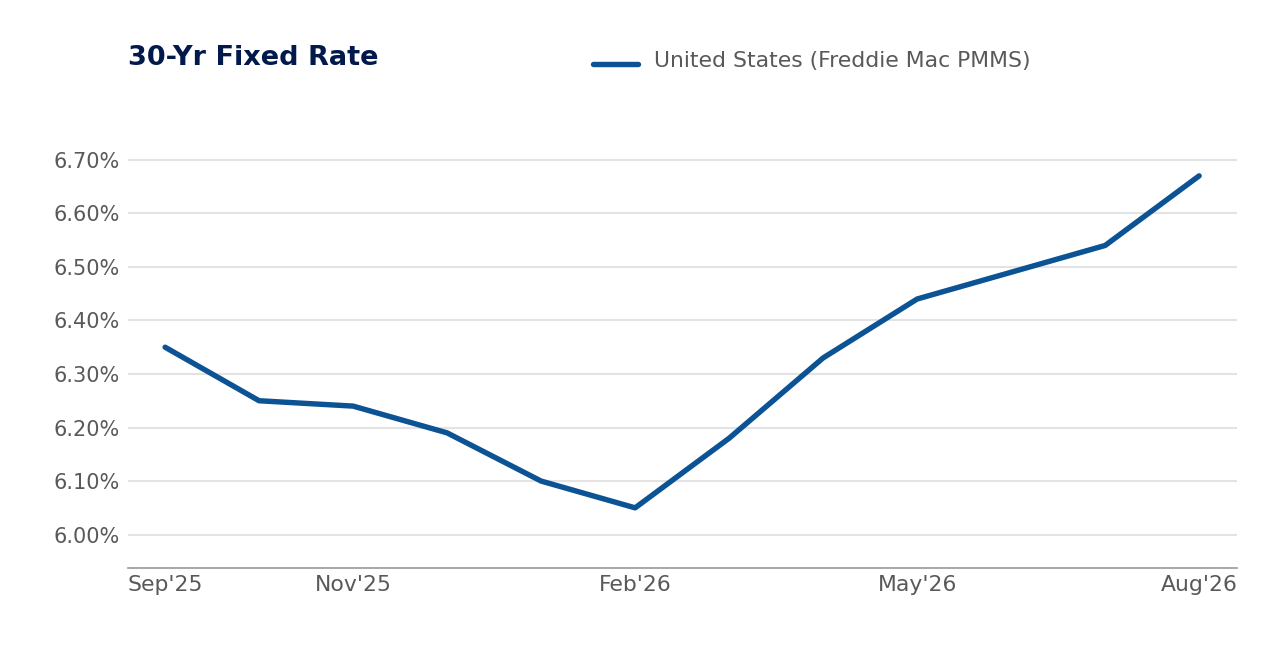
As of early September, the 30-year fixed rate averaged 6.71%, up from 6.50% a year ago — about a 0.21-point increase. Rates haven't moved dramatically either direction over the past year; they've mostly held in a narrow band.
The messaging here doesn't change month to month: there's no clear signal that waiting for a meaningfully lower rate is a winning strategy right now. Plan around today's number, not a hoped-for one.
What This Means for Buyers
Softer demand, flat inventory, and prices that are still climbing on a typical-home basis is a specific kind of window — not a crash, but real room to negotiate on days-on-market and terms where a year ago there wasn't much. Homes are sitting longer, which means less competition on the properties that aren't perfect, and more leverage on price, concessions, and timelines.
The move right now is to get pre-approved and know your target neighborhoods and price range before the right listing shows up, so you can act while a home is still fresh rather than after it's been sitting for six weeks.
What This Means for Sellers
The margin for error shrank this year, not the opportunity. Homes that are priced against current (not last year's) comps, shown at their best, and marketed beyond just an MLS listing are still moving in a reasonable window and still landing solid prices — the median is proof of that. Homes that skip any one of those three things are the ones sitting 70+ days.
If you're planning to list, treat the pricing conversation as more important this fall than it's been in the last couple of years — overpricing against a softer buyer pool is a slower, costlier mistake right now than it would have been a year ago.
Quick Stats: August 2026
- New Listings: 805 — down 0.5% year over year
- Active Listings: 2,749 (4.4 months of supply) — up 0.2% year over year
- Closed Sales: 440 — down 22.3% year over year
- Days on Market: 52 days (71 cumulative) — up 13.0% year over year
- Median Sale Price: $678,000 — up 4.2% year over year
- Interest Rates: 6.71%, up from 6.50% a year ago